
Elections give us posters. They also give us polls. And there have been lots of polls in recent weeks as interest in the forthcoming set of elections and their implications for the next general election grows.
Results vary.
Each company uses a slightly different methodology and while each sees its poll as indicating the state of public opinion, it is normally best to compare any poll finding with others results from that same company.
 TCD Professor Michael Marsh looks at all the polls taken recently
However, when we have such a large number of polls taken at about the same time it does make sense to pool the results.
Even allowing for differences in method, this gives us a lot more than the typical 1,000 or 1,500 cases. It increases the confidence we can have in the findings, and in particular gives us many more cases on which to base analyses of patterns within public opinion.
Table 1 shows average poll findings for each month in 2014. The May polls reveal a fairly even breakdown between four groups, Fianna Fáil, Fine Gael, Sinn Féin and Independents and Others.
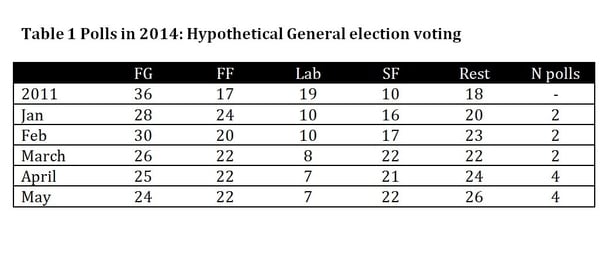 Relative to 2011, we see huge losses by Fine Gael and Labour and big gains by Sinn Féin and Independents and Others.
Fianna Fáil has also made gains. Looking at the pattern across 2014 suggests a decline by Fine Gael and Labour even in 2014, and steady gains by SF and particularly by others.
This more evident if we look at Figures 1 and 2. These are based on all polls taken since 2011, mapped onto the 39 months since Feb 2011.
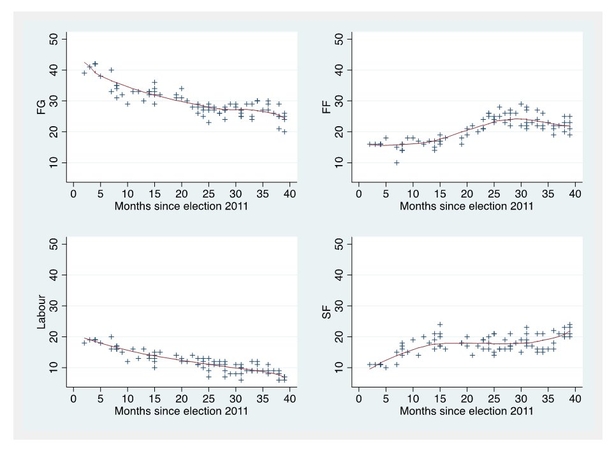
Figure 1 shows the record for each of the four main parties and Figure 2 shows the results for Independents and others.
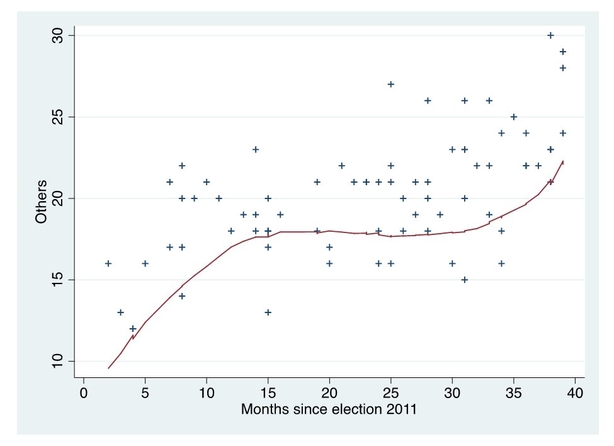
The lines show the general trends. Vote shares for both Fine Gáel and Labour have fallen, but there is some sign that this fall has intensified recently. Sinn Féin has shown growth, particularly over the last few months, but Fianna Fáil's gains peaked in late 2013, since when it has fallen back. As Figure 2 shows, the main beneficiary are independents and others. Most striking here is the fact that the last few polls almost all put others above well over 20%. The real rise above 2011 levels dates back about 6 months, but appears to be gaining in strength.
Voting intentions in the forthcoming European parliament elections have also been assessed in several polls, and in six of them this has been done by presenting respondents with 'mock' ballots, comprising the names and parties of the candidates.
European parliament results often differ considerably from what we might expect in a general election or even a local election fought at he same time.
This may be because people are unsure about the role and power of MEPs but also because while the candidate factor is always important, in a European election this factor is confined to only three constituencies rather than 43.
Table 2 shows the average party support by constituency. There is no apparent trend across the polls taken during the campaign so I have simply averaged them.
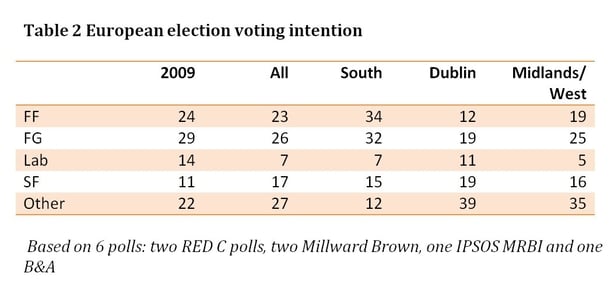
The most interesting aspect of these results is the likely destination of the 11 seats at stake. The polls do not differ significantly in many respects on likely seats won by each party, but the destination of the final seat in each constituency is very open. Fine Gael look set to win three to four, Sinn Féin two to three, Fianna Fáil one, with a chance of one or two more, and independent candidates at least one and perhaps one or two more. Labour and Greens also have some hopes of winning the last seat in Dublin.
Comparing Tables 1 and 2 we can see that there are some big differences between the projected European party standings and general election vote intentions.
Sinn Féin – even though it could win 3 seats – is polling significantly below its (hypothetical) general election levels.
This is perhaps because of the existence of some strong independent candidates, particularly in Dublin and Midlands/west, but 'others' as a whole are really no stronger in Europe.
Clearly the state of public opinion is very different from what it was in 2011, at the last general election, and even somewhat different from what it was in the local and European elections in 2009. Projected 2014 European voting does not look so different from 2009 but the seat distribution may differ more than the vote patterns.
Using the last two RED C and last two B&A polls we can map the flows in public opinion since 2011. This is shown in Table 3.
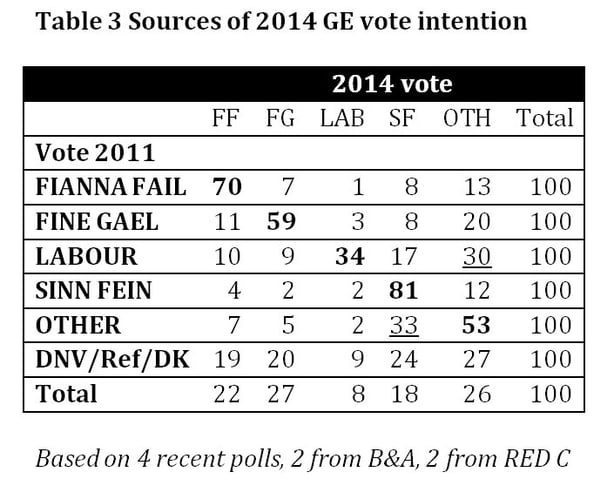
The most obvious thing here is the disintegration of Labour support since 2011, two thirds of which has left the party, even ignoring those who are undecided this time. The main beneficiaries are independents and others, winning 30% of Labour's vote, while SF picks up 17% and Fine Gael and Fianna Fáil together another 19%. In other words, Labour's voters have scattered.
Fine Gael has also lost a significant number of votes to others, with 20% of its 2011 support choosing that alternative. In contrast, Fianna Fáil and even more strongly Sinn Féin held onto its 2011 voters and added those of other parties.
Supporters of 'Others' are also relatively volatile, with Sinn Féin the most likely alternative for those choosing someone different. Those who did not vote, or do not recall how they voted for the most part look like other voters in their current choices except that they are more likely to support Sinn Féin and less likely to choose Fine Gael. Even so, this group is typically less likely to vote than the rest of the sample.
Finally, Table 4 shows the choices made by voters – general election vote intentions – in the different social groups used by market research companies.
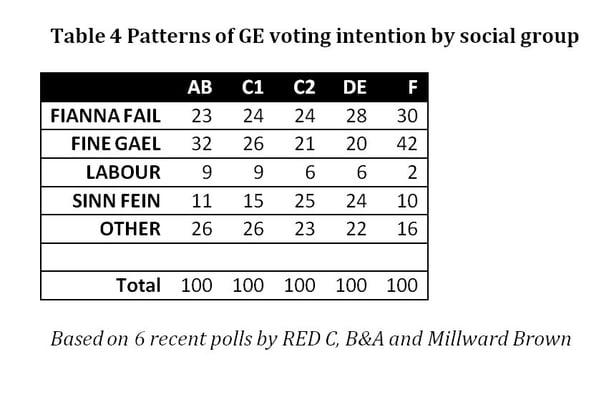
ABs are the professional and managerial middle classes, C1s are the clerical white collar workers and junior professionals; C2s are skilled manual workers, and DE comprises unskilled and dependents. F is farmers. As might be expected, Fine Gael is stronger in the AB and C1 groups, and Sinn Féin much stronger among the C2DE groups. In fact it is the most popular option in the C2 group. As has been the case for a long time, Labour continues to be a little stronger among the ABC1 than C2DE groups.
As Sinn Féin grows stronger there appears to be a more marked class basis to our politics than we have been used to for the last 30 or 40 years since polling started but – Sinn Féin apart – political divisions are still only weakly reflective of different socio economic groups.