

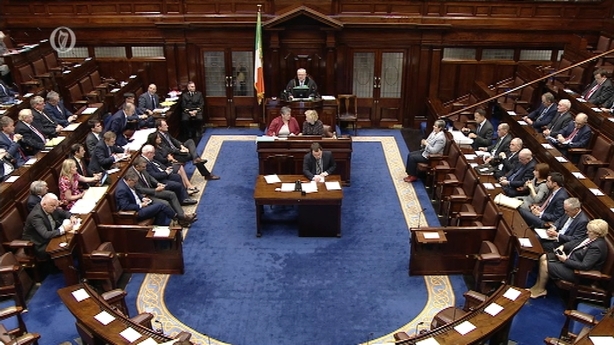
Our Government, complete with "new politics", has now been in existence for just short of three years.
On Monday it will be three years since the deal was done with Fianna Fáil, and the following Monday will mark the third anniversary of the Dáil’s approval of Enda Kenny’s second term as Taoiseach.
And in just a few more weeks, it will be the first electoral test of both Fine Gael as a Government party, and Fianna Fáil and Sinn Féin in their different opposition roles.
Recent polls provided some mixed evidence on how the public viewed these three years, as well as what might happen at the end of May.
Red C, for the Sunday Business Post, suggested Fine Gael on 33% maintained a ten-point lead over Fianna Fáil, with Sinn Féin well back at 14%, while Behaviour and Attitudes for the Sunday Times gave Fianna Fáil 29% and a one point edge over Fine Gael with Sinn Féin trailing just eight points behind.
Curiously, Behaviour and Attitudes and Red C have typically been fairly close with respect to Fine Gael and Fianna Fáil, though they have differed more on Sinn Féin. The so-called margin of error is little help in explaining this, as party support differs across the polls by seven points (SF), six points (FF) and five points (FG).
There is of course some random variation in sampling and this would account normally for discrepancies of 1-2 percentage points either way in these figures but the explanation must lie more with the way the different samples deviate from pure randomness – not least in the levels and nature of non-response, by the adjustments made by each company in trying to deal with likely voters and undecideds, and by the different question wordings employed.
There is no way to say who (if anyone) is right. We can look at previous elections to see who was closest to the actual results last time. The limitation of this is that would give us only one point of evidence, and even this would be undermined by the fact that companies have in some cases changed exactly how they do things since that time, or the fact that some did things differently just prior to the election than they would in "normal" polls.
What I can do here is to look at a bigger picture, including all polls over the last few years and identify the trends as a more broadly based estimate of where party support level stands now. Polls used here include those from Behaviour and Attitudes and Red C, as well as IPSOS/MRBI (for The Irish Times), Millward Brown for Independent Newspapers and Ireland Thinks for the Irish Daily Mail. I have taken polls back to February 2015, giving 118 polls in total.
Figure 1 shows trends for Fine Gael, Fianna Fáil, Sinn Féin and all Others. Each poll is shown by a small yellow cross with long-term trends in green. Each party’s graph is divided by vertical lines showing February each year, as well as a horizontal dashed line showing the vote at the 2016 election.
Fine Gael’s support fell after the 2016 election - when it underperformed relative to most polls - but rose through 2017 alongside its new leader before declining slightly over the last year.
Fianna Fáil exceeded expectations set by the polls in 2016 and initially built on that performance, but the high point was in the middle of 2016 and the party has more or less been stuck at its 2016 vote share for more than a year now.
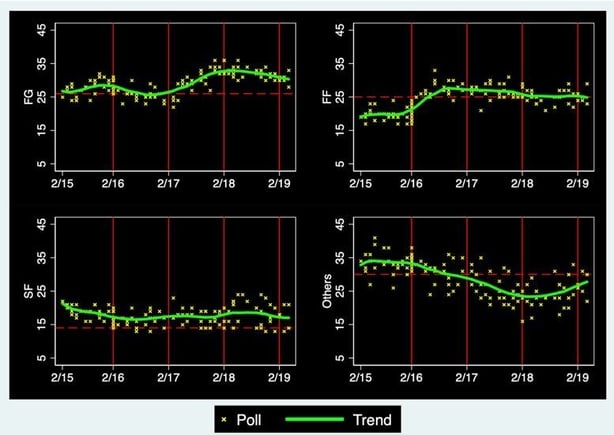
Sinn Féin’s support varies across polls a little more than it does for Fine Gael and Fianna Fáil, probably because of the different ways companies deal with the fact that not all respondents will vote. The general trend is fairly level, around where it was in the polls in 2016 and a few points above its actual vote.
Of course, if we assume the 2016 pattern of error would be repeated in any general election in the near future, we might well say that the big two parties were neck-and-neck with Sinn Féin well behind, but this would be an assumption without much foundation, since the relationship between polls and actual votes is far from consistent over time.
The biggest variation over time and across polls is the support for ‘Other’ parties and independents.
Support for ‘Others’ declined after 2016 as combined support for Fine Gael and Fianna Fáil grew, at times giving them close to two thirds of the vote, but more recently support has risen again. Particularly striking though is the persistently broad band of yellow crosses, running from a low of 16% to a high of 33% over just the last 16 months.
Figure 2 shows patterns of support for some of the smaller parties, including Labour, the Greens, Solidarity-PBP and the Social Democrats, all of whom typically exceed 1%.
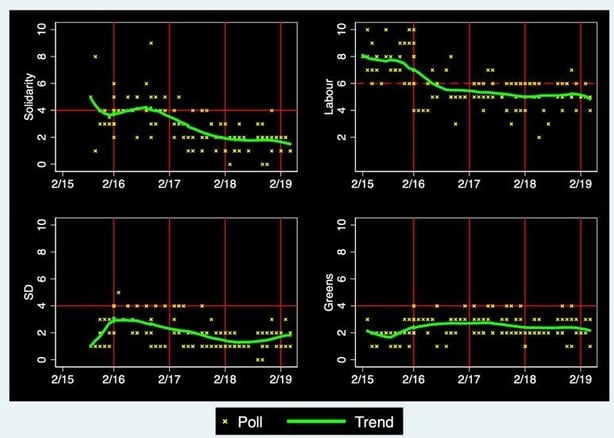
Labour’s poll support is close to the 6% won in 2016 but has almost never exceeded that figure, and the trend is no more than 5%. Solidarity-PBP’s support is close to 2%, half that won in 2016, with Greens and Social Democrats also running at around half their 2016 vote.
Arguably these parties are less visible between elections and not all are listed initially in the options provided for voters. The recent growth in Others’ support is down less to any growing support for these smaller parties and seems to stem more from the growing attraction of independents in the various incarnations.
Table 1 shows where the trend line leaves each party as of April 2019. Fine Gael and Sinn Féin are up, the smaller parties are all down. Independents and others are also down but this is due to the near disappearance of Renua: Independents by themselves are where they were, as are Fianna Fáil.
Table 1 Poll support April 2019
|
Party |
Poll Support |
Change since 2016 election |
|
Fine Gael |
30% |
+4 |
|
Fianna Fáil |
25% |
- |
|
Sinn Féin |
17% |
+3 |
|
Labour |
5% |
-1 |
|
Greens |
2% |
-1 |
|
Solidarity |
1% |
-3 |
|
SocDems |
2% |
-1 |
|
Ind/Others |
18% |
-2 |
It seems as if we will not see how these figures translate into general election support anytime soon (perhaps one of the rare positives of Brexit) but we do have elections in May for local councils and the European Parliament.
Variations in issues and candidates mean we would never expect general election support to translate simply into support in other elections. We know some people vote for different parties in local and European Parliament elections, and the evidence is that if there were a general election at the same time some would choose differently in that too.
Table 2 shows the poll trends in May 2014 and support in Local and European Elections. There is a mixed pattern of differences. Fine Gael, for instance, outperformed its poll rating in Local Elections but underperformed in the European Elections (although it did win 4/11 seats). The main point is that Fine Gael and Fianna Fáil each look a little stronger than they were in 2014 and Sinn Féin a little weaker, but these differences are marginal.
There is no reason to expect anything very different in terms of votes, but narrow margins will decide who wins those 11 or 13 seats in the European Parliament.
Table 2 Polls and 2014 elections
|
Parties |
2014 Local election |
2014 EP election |
POLLS May 2014 |
Difference |
|
|
FG |
26% |
22% |
24% |
+2/-2 |
|
|
FF |
24% |
22% |
22% |
+2/= |
|
|
SF |
15% |
20% |
22% |
-7/-2 |
|
|
Lab |
7% |
5% |
7% |
=/-2 |
|
|
Greens |
2% |
5% |
2% |
=/+3 |
|
|
Others |
27% |
26% |
24% |
+3/+2 |


