
There were a couple of questions about turnout going into this election. One was how turnout might be affected by the decision to hold an election on a Saturday.
People might have more time to vote and students going home for the weekend might have the opportunity to make use of the home registration, although for some there would be a downside and we should not expect to see any boost.
The second was how differential turnout across certain social groups might have a significant impact on the result.
There are no final turnout figures in as yet, but there is reason to believe turnout is much the same and it was down marginally; the weather rather than the day of the week might be a more plausible excuse.
When it comes to those who voted, we do have some evidence from the exit poll, which was carried out by Ipsos MRBI for RTÉ, The Irish Times, TG4 and UCD.
Voters were interviewed at random and this should give us a good idea of the composition of the group who booted as opposed to the electorate.
One of the strongest links to voting is age: we know young people in general are typically less likely to vote than older electors.
We can compare voters with the population (the only hard data we have on the electorate) and see the differences.
This is shown in the graph below, which shows the share of electors and voters in each age group.
Where the orange line is shorter than the blue one a group is less likely to vote; where it exceeds the blue line it is more likely to vote.
It shows for those in the 18-24 and 25-34 groups, turnout was less than average, as for those 65+, while those in the 35-49 and 50-64 groups are more likely to vote.
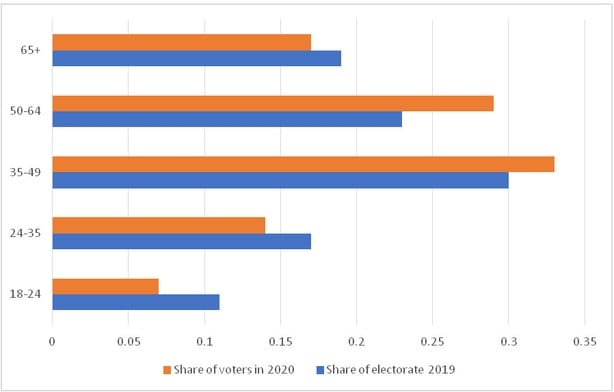
This is normal, and a similar pattern held in 2016.
How does this impact on party support?
If a party depended heavily on the younger age groups, this differential turnout would hurt it, whereas a party much more attractive to those over 35 would benefit from this pattern, unless they had a very large number of much older voters.
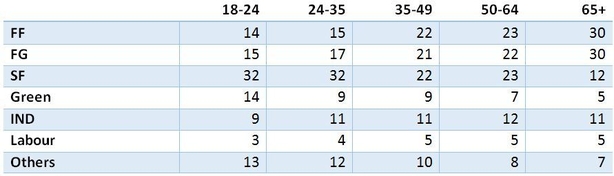
The exit poll gives us the distribution of party support by age.
To some degree this echoes what we have seen before, particularly in 2016. Fianna Fáil support was stronger amongst older voters, and Sinn Féin was stronger among younger voters, being the largest party even in 2016 in the youngest age groups.
However, this time that party's support has extended into the 35-49 bloc, where turnout is high. Did this help in 2020?
We can answer this question by adjusting the figures so that each age group has the weighting in the sample that is in accord with the weight in the electorate.
In other words, what would the result look like if there were no differences in the propensity of each age group to vote?
The answer is: it would look almost exactly the same!
Sinn Féin support increased affected by 1% with such a turnout pattern, as did Green support marginally, but these are very small numbers.
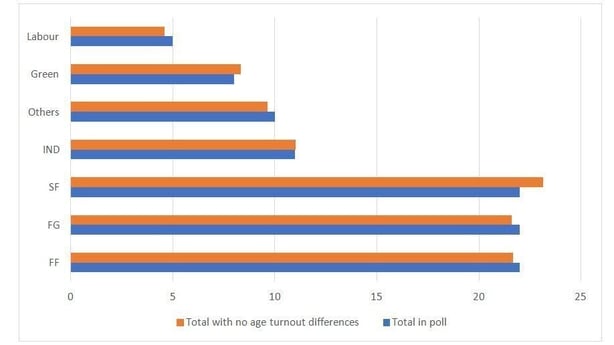
This was not the case in 2016, where age turnout patterns pushed up Fine Gael by a couple of points at the expense essentially of Sinn Féin.
But as Sinn Féin support has grown much stronger among those of middle age, that disadvantage has disappeared. Moreover, the party benefits from its relative unpopularity among those of pension age.
Of course there are other turnout differentials; by area and social class for instance, particularly in Dublin.
But the chances are as Sinn Féin has broadened as it appear, this effect would also be much smaller this time.


