
In the absence of tallies, let alone actual results, the RED C Exit poll for RTÉ TG4 provided the basis for a lot of interesting discussion and analysis for a long time over the weekend.
Such polls also provide the opportunity to look behind the results for information on the sort of people who vote for different candidates, their attitudes to issues and the reasons they provide for their choices.
Not for the first time though, the exit poll did not estimate all parties’ support accurately, nor did it correctly predict the votes won by the 59 separate candidates across the three European election constituencies.
This has occasioned much comment, particularly from Fianna Fáil sources complaining at the consistent underestimation of their party’s strength.
The Greens, in contrast, tended to be overestimated, which disappointed those who had hoped for three seats on Saturday morning.
I will look here at the record of exit polls over the last 20 years or so, asking about the accuracy, and the sort of error made about some of the parties.
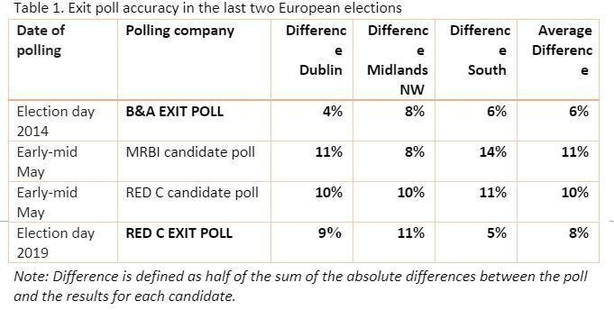
Table 1 shows the information for candidate polls in 2014 and 2019. Error here is measured by looking at the percentage of respondents you would have to move to different parties/candidates to get the right result.
The table shows the error in each constituency, and the average error overall. I also show the two candidate polls done during the 2019 campaign for comparison.
The 2019 exit poll made an 8% error on average, and so was a better predictor of the actual result than the campaign polls (it is unfair to call the differences between campaign polls and results errors as real change may have taken place) and a little worse than in 2014 when the average error was 6%.
RED C were close in the South constituency, but further off in Dublin, and even more so in Midlands-North-West.
These polls have around 3,000 respondents altogether, but only around 1,000 in each of the three areas.
The margin of error is given as 4% by RED C. This means that an estimate should be within 4 percentage points of the real figure.
If a candidate actually gets 50% of the vote, the sample estimate - the poll figure - should be between 46 and 54.
However, it should be closer to the real outcome as that moves away from 50. If a candidate won 20%, our poll figure should be more in the range 17-23, the range getting tighter as the figure gets further from 50%.
Occasionally the poll may come outside that range, but this should be unusual, expected in only 5/100 samples - if exit polls were fully random samples.
RED C cautioned readers of its report, explaining that practical sampling could lead to bigger errors.
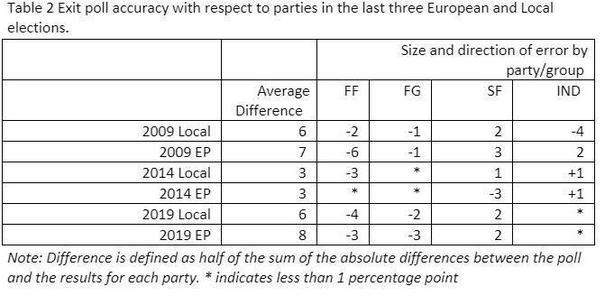
While some remarks were made about the exit poll in general terms there have been more pointed comments on the errors made with respect to individual parties. These are explored in Table 2.
This shows the size and direction of errors for some parties and Independents in exit polls since 2009, looking at estimates of both the local and European vote.
The table gives details for selected parties but the average figure provided covers all of them. When we look at the average difference between the distribution of party support in the poll and the actual outcome, the error in the RED C poll looks like that in the 2009 Lansdowne poll.
The estimates were further off the mark than were B&A’s in 2014, but arguably this difference is small.
There is some indication that the local poll estimates are better than the European ones.
This is not due to sample size: in terms of national party figures the sample is the same size in both, although if the candidates are more important in European elections the possibility of error is greater.
What is more striking though are the sort of errors made by party. All polls underestimated Fianna Fáil support, and none overestimated Fine Gael support.
In contrast, Sinn Féin support is typically overestimated, but not always. In the candidate polls this time we saw a similar pattern, but Fianna Fáil support was estimated accurately in the South constituency - contrary to the broad pattern.
Of course, Green support was exaggerated in the poll this time, but not in previous polls, when it would in any case have been much smaller.
We can also look at exit polls for general elections as these take us back a little further. The sample size is usually a little larger here, certainly in recent years. This is done in Table 3.
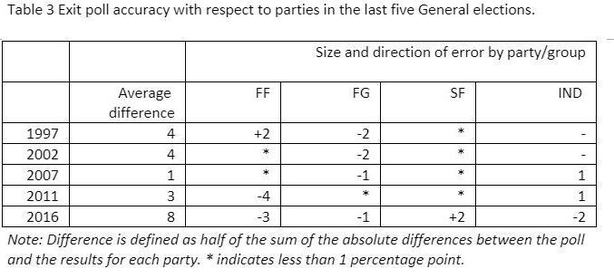
On only one occasion has one of the larger two parties been overestimated: Fianna Fáil in 1997.
The underestimation of Fianna Fáil is quite recent. It is also apparent that 2016 saw more error than any other election.
The reasons why sample estimates and actual results differ are many.
First, there is what we might think of as simple sampling error. In any sampling exercise, there will be variation between samples, even if they are drawn randomly, which means each voter will have the same chance of being included.
This is the basis of the margin of error concept, which has known statistical properties. Exit poll samples are not perfectly random: there is no way to do that. Interviewers are located around a sample of 156 polling stations across the country.
While polling stations are chosen randomly, they would be chosen in such a way as to ensure a proper representative balance of urban and rural districts and varying population density.
This is done for practical reasons, but because of the grouping of interviews by polling station, sampling error is likely to increase. It will do so to the extent that voters in one polling station make different choices from those in another.
It is hard to know which polling stations might see early voting and which ones see more voting late, and given the absence of data at this level we don’t know whether more interviews should be done in some than others.
Although it is easy to see why the operational difficulties of sampling lead to error, it is harder to link them to the sort of systematic error that we tend to see. Non-response is a more likely candidate here.
Over the course of the day interviewers stop and question what is typically the next person leaving the polling station. Not all are willing of course.
Are these people different in some systematic way? Were (the more elderly) Fianna Fáil voters more dismissive of interviewers? Were (the younger) Green voters only too please to spread their message.
There was much talk in Britain about "shy" Tory voters who biased polls because of their unwillingness to be interviewed. It was a good story, but thorough investigations into polling failures found little evidence to support it and good evidence for other explanations of error.
It is harder to see why the big parties are generally underestimated. That is not consistently the case in pre-election polling.
There could be a sampling bias, perhaps too few older voters. There is no way to know because the only evidence we have on who votes comes from exit polls, whereas in other countries there are systematic national election studies, substantial surveys carefully done post-election. Ireland has not committed the resources to provide such studies here.
Exit polls could be made more precise if any organisation, governmental or private, was willing to provide the necessary money to increase sample size, locations, interviews and time windows.
It is noticeable that the BBC exit polls have greatly improved since they substantially increased their spending.
We must have some sympathy for those voters who were willing to stop and answer questions. It was hard enough to search through more than half a meter of ballot paper without having to remember afterwards what you did, who you did it to, and in which election.
Meanwhile, the counts go on.


