
For years, detailed collision location data was not publicly available in an easily searchable format, following concerns around privacy and GDPR compliance.
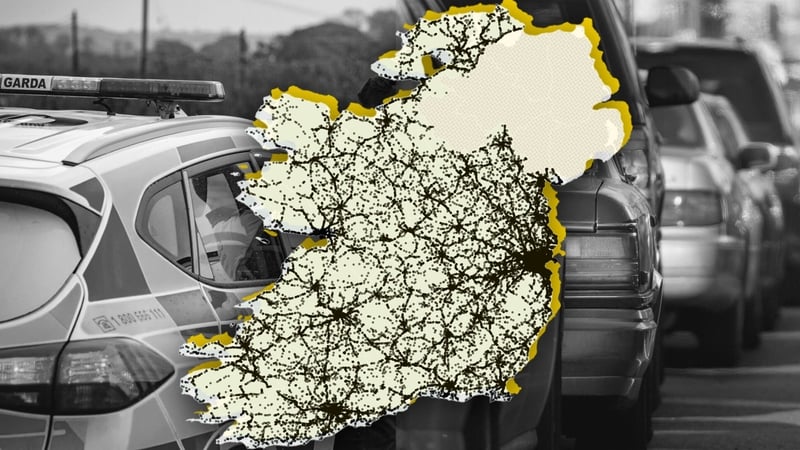
The data had been unavailable for almost six years before the Road Safety Authority (RSA) recently restored an interactive map showing where road traffic collisions causing injury or death have happened across Ireland between 2016 and 2024.
The publication of the map follows longstanding calls for greater transparency around collision data and gives the public one of the clearest pictures in years of where serious and fatal crashes are happening across the country.
The map contains over 50,000 injury collisions, ranging from fatal crashes to incidents resulting in minor injuries.
When viewed together, the data reveals not just individual crashes, but the broader scale and persistence of road trauma across Ireland.
Behind every point on the map is a person, and viewed individually many of these collisions barely register beyond local headlines. But taken together, they reveal the scale of road trauma across Ireland.
View: The collision map is available on the RSA's website by clicking this link
The map shows Dublin and the major urban centres account for the highest number of collisions overall which reflects the volume of traffic, commuting and population density on Irish roads.
Analysis of the data by Prime Time shows Dublin accounted for almost a third of all recorded injury collisions in the dataset.
Cork, Limerick, Galway and Kildare also recorded large volumes of collisions over the eight-year period.
But the data also reveals a very different pattern when looking not at the number of collisions, but how severe they are.
While urban areas account for the largest overall number of collisions, crashes in more rural counties were significantly more likely to result in death or serious injury.
In Monaghan, roughly one-in-three recorded injury collisions involved death or serious injury.
Mayo, Wicklow and Meath also ranked among the counties with the highest proportions of severe collisions.
We need your consent to load this flourish contentWe use flourish to manage extra content that can set cookies on your device and collect data about your activity. Please review their details and accept them to load the content.Manage Preferences
The figures do not necessarily mean these counties are the most dangerous places to drive. The data does not account for factors such as traffic volume, distance travelled or population density.
However, the pattern is consistent with longstanding road safety concerns around rural roads, including higher speeds and road design.
At a local level, the map also reflects concerns long raised by communities.
Along Dublin's Crumlin Road, a visible concentration of serious and fatal collisions stretches from Dolphin’s Barn towards CHI Crumlin - the same corridor where residents and campaign groups have repeatedly raised concerns around road safety.
Calm Crumlin Road, a local campaign group, said the publication of the map "confirms what communities like ours have been saying for years."
"Collision data matters, transparency matters, and dangerous roads cannot be addressed without public access to evidence," they said.
Prime Time previously reported from the area following the death of cyclist in 2023.
The collision map cannot explain why crashes occur, nor does it account for traffic volume or road usage. For many residents and road safety advocates however, the pattern visible here will feel familiar.
"Campaigners, councillors, journalists and residents have been calling for this data to be made publicly available for years, and we hope it marks the beginning of a more transparent and evidence-based approach to road safety across the country," the statement added.
The group added that it hoped the data would now be used "to identify dangerous roads earlier and support meaningful safety interventions before serious injuries or fatalities occur".
The data also reveals clear differences depending on when collisions happen.
Collision volumes rise steadily through the morning and peak between 4pm and 8pm, when roads are at their busiest.
But the proportion of collisions resulting in death or serious injury peaks overnight, between midnight and 4am.
In other words, there are fewer collisions in the early hours of the morning, but those collisions are significantly more likely to have serious or fatal outcomes.
We need your consent to load this flourish contentWe use flourish to manage extra content that can set cookies on your device and collect data about your activity. Please review their details and accept them to load the content.Manage Preferences
The dataset itself cannot explain why this happens.
However, the pattern broadly aligns with longstanding road safety concerns around speeding, fatigue, reduced visibility and impaired driving during late-night hours.
The data also highlights how collisions can impact different road users very differently.
Drivers accounted for the largest number of casualties overall by far.
But more exposed road users were much more likely to suffer severe outcomes.
Motorcyclists stood out in particular, with almost half of recorded motorcyclist casualties resulting in death or serious injury.
Pedestrians and cyclists also recorded significantly higher proportions of severe outcomes compared with drivers and passengers.
E-scooter users also appeared relatively high on the severity scale, with 26.4% of recorded casualties resulting in death or serious injury, though the category represents a relatively small and still emerging part of the overall collision dataset.
We need your consent to load this flourish contentWe use flourish to manage extra content that can set cookies on your device and collect data about your activity. Please review their details and accept them to load the content.Manage Preferences
The figures do not measure overall risk by transport type, as the dataset contains no information about journey numbers or exposure.
Instead, they show how severe outcomes are when different road users appear within the collision data.
The collision map is based on road traffic injury collisions recorded by gardaí and does not include broader hospital injury data. That means some road-related injuries, particularly incidents that may not be reported to gardaí, may not be fully reflected within the dataset.
Since 2016, the dataset records 1,287 fatal collisions on Irish roads.
A further 11,152 have resulted in serious injury - typically involving injuries requiring hospital treatment - with more than 38,000 causing non-serious injuries, although the figures are based on Garda-recorded collisions and do not include all hospital-treated injuries.
The publication of the map comes amid continuing concern over road deaths and serious injuries, with road safety remaining a major policy challenge despite years of awareness campaigns, enforcement measures and infrastructure investment.
A report from Jack McCarron on this subject is broadcast on the 26 May edition of Prime Time on RTÉ One and RTÉ Player.