
New research from the Central Statistics Office reveals that households paying a mortgage experienced the highest estimated inflation rate in the 12 months to September.
The CSO said that inflation stood at 6.4% in September of this year but noted that households paying a mortgage had an estimated annual inflation of 7.8%. This compared with a rate of 5.6% for households that own their home outright.
The new breakdown of the inflation figures by the CSO also estimates that households with the highest incomes experienced higher inflation of up to 6.9%, while some lower income households had annual estimated inflation of 6%.
Today's figures also show that the annual inflation rate for urban households was 6.5%, while estimated inflation stood at 6.3% for rural households.
Households where the reference person was aged under 35 had an estimated inflation rate of 5.8%. However, when the household reference person was aged 35 to 64 it was estimated at 6.7% and was 6.1% for those aged 65 or over.
The CSO said the household composition types with the highest estimated inflation rate of 6.8% were households with one adult without children and households with two adults with more than three children, or households containing three or more adults with children.
Households with three or more adults without children are estimated to have experienced the lowest rate of inflation at 5.9%, the CSO added.
Joseph Keating, Statistician in the CSO's Prices Division, said that the increasing rate of inflation since the middle of 2021 has prompted greater interest in price change and its effects on households.
Mr Keating said that each household has its own unique consumption pattern of goods and services and therefore its own personal experience of inflation.
He said the estimates in today's figures have been calculated by combining the CPI results from September 2023 with more detailed expenditure data from the 2015/16 Household Budget Survey.
Today's figures also looked at inflation trends over the last five years.
They show that in the five years from September 2018 to September 2023, the rate of inflation rose by 19.1%, with one-third of this change being concentrated in the final 12 months of that time.
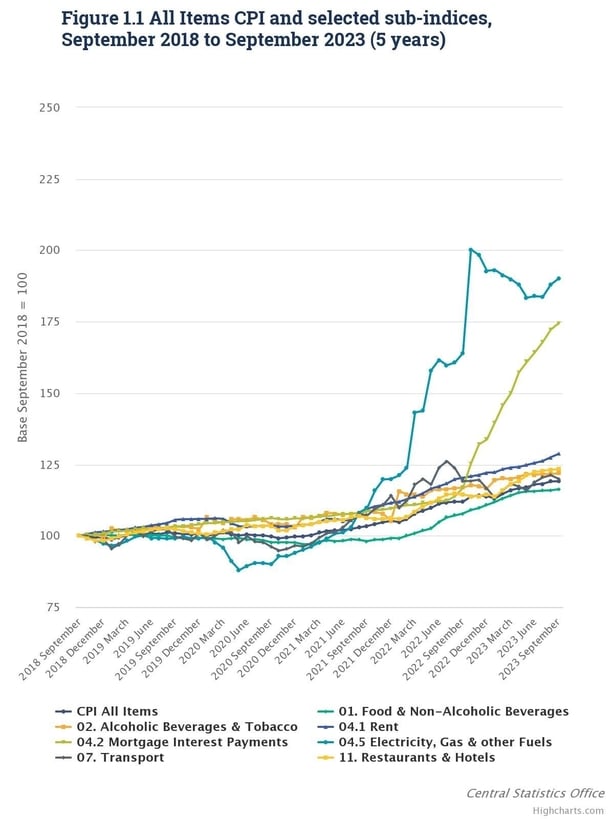
The CSO noted that Electricity, Gas & Other Fuel prices rose by 64% in the four years between September 2018 to September 2022, followed by an increase of 15.9% in the year from September 2022 to September 2023.
It said this means that prices for Electricity, Gas & other Fuels in September 2023 were 90.1% higher than five years earlier.
Meanwhile, the index for Mortgage Interest Payments rose by 16.8% in the four years from September 2018 to September 2022, and by 49.5% in the year from September 2022 to September 2023. The Mortgage Interest Payments index was 74.5% higher in September 2023 than five years earlier.
And the index for Rent increased by 20.3% in the four years from September 2018 to September 2022, and by 7% in the year from September 2022 to September 2023. The Rent index was 28.5% higher in September 2023 than five years earlier, the CSO said.