


These four maps summarise some of the most devastating aspects of the Great Famine, including striking regional variations in Famine fatalities and landlord evictions, as well as the extraordinary disappearance of so many family holdings and the scale of estate changes at the end of the Famine.
Click through to each map to see how, all over the country, the Irish people and landscape were transformed by the Famine.
Map 1: Percentage number of deaths recorded for each county 1846-51 as a proportion of total deaths recorded 1841-51
The Census of 1851 provides figures for the number who died in each county in each year from 1841 to 1851. While generally recognised as underestimated, they do give a very good indication of the relative distribution of excess deaths – and therefore the intensity of the famine catastrophe – across the island.
Of the total number of dead recorded for the 1840s decade, the county average for deaths during the Famine years (1846 - 1851) is 77.3%. But the returns range from 70.7% for Dublin city to over 86% for Galway city.ine fatalities.
Map 2: percentage of evictions, 1846-1852
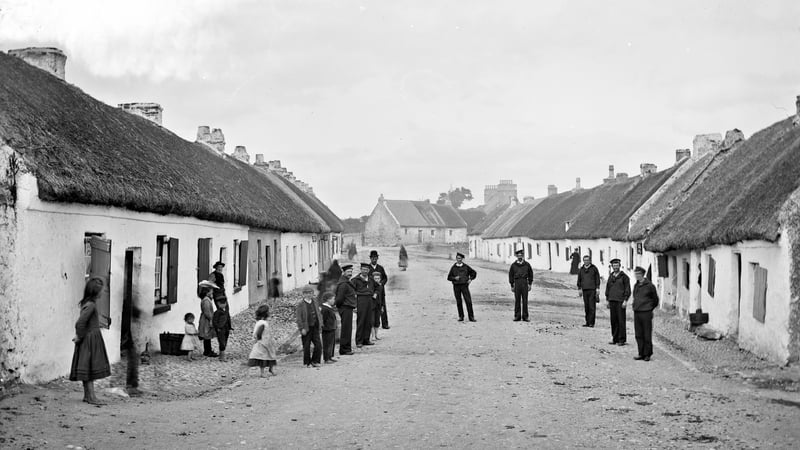
During the Famine, Irish landlords and their land agents engaged in a campaign of mass evictions. After 1847, the amount of money that Irish landlords were required to pay in Poor Law taxes increased. The more tenants on a landlord's estate, the higher his tax.
This was a strong motive for many landlords, already carrying large debts, to clear their land of their smallest properties - those valued at £4 or less per year. These evictions occurred most frequently in the more remote, poorer regions of the country where the practice of subdividing the land into smaller and smaller holdings had been at its highest.
It is estimated that over 100,000 families (approximately half a million people) were evicted throughout Ireland during the Famine years. Some were forced into workhouses, some managed to emigrate but many others died. Not surprisingly, the famine evictions left behind many bitter memories in Irish rural communities.
Map 3: percentage reduction in number of holdings over 1 acre, 1847-53
The Holdings map shows the percentage reduction in number of holdings over 1 acre, 1847-53.
By 1853, the landscape of Ireland had been utterly transformed. The Famine years saw the rapid disappearance of almost 93,000 holdings of 1-5 acres in size. If you include the smallholdings under 1 acre in size, the number increases to 300,000.
Smallholdings of 5-15 acres declined by almost 40% between 1845 and 1951. The north and east of the country lost far fewer smallholdings than the south and west where the loss was enormous. County Clare lost a staggering four out of every 10 farms (42.4%).
Eviction by landlords was not the only reason for the enormous decline in smallholdings during the famine. Other people abandoned their homes to seek relief elsewhere or to emigrate. In other cases, entire families were wiped out by death.
Map 4: percentage of Townlands auctioned, 1849-55
Even before the Famine, many landlords had large debts. These debts grew even larger during the Famine due to unpaid rents, higher Poor Law taxes and in some cases, heavy spending on relief schemes to help the victims of the Famine.
In July 1849 the government passed the Encumbered Estates Act, which established a commission with great powers to sell landlords' property in order to clear their debts. The map shows the percentage of land in each of the 32 counties sold through the Encumbered Estates Courts.
This piece is part of the Great Irish Famine project coordinated by UCC and based on the Atlas of the Great Irish Famine. Its contents do not represent or reflect the views of RTÉ.